Welcome to the FlySafe bird migration prediction module
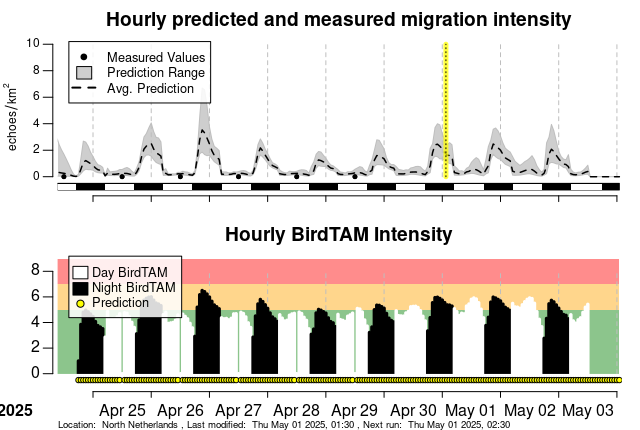
This page provides a 72-hour forecast of bird migration intensity for the North Netherlands location. The predictions are provided in two formats. The Hourly predicted and measured migration intensity plot shows the measured bird density values in bird echoes/km2 (black dots) as well as the mean predicted bird density (dashed line) and prediction range (gray). The prediction range is produced by an ensemble forecast of ~50 models. The Hourly BirdTAM Intensity plot shows the bird densities converted to BirdTAM warning levels for pilots from seven days in the past and three days into the future. If the measured value is available, the BirdTAM intensity reflects that measured value. If no measurement is available, the mean bird migration density prediction is used (indicated by small yellow circle).